Setting up Production Monitoring for Remix on Fly.io
At UDisc, we are migrating our legacy meteor.js stack to Remix, and I cannot be more excited! With all of the options for deployment available to us, we are settling on Fly.io and it has been a wonderful experience so far.
If you didn't know, Fly.io hosts a prometheus server for you and automatically tracks several metrics about your app. This is great, and we can even add our own Node.js (or perhaps Remix-specific) metrics as well. Tracking all these metrics will be fantastic, but how do you view them? Well, Fly.io has you covered there as well. We'll follow their instructions and get our very own Grafana dashboard up and running to view the built-in metrics and our own metrics exposed via our express.js server.
You can follow along by starting with the Remix Blues Stack. The finished product will be the Synth Stack.
First, a bit about Prometheus
"Prometheus is an open-source systems monitoring and alerting toolkit." The key difference between it and other systems, is that Prometheus scapes the monitoring data from your app, instead of your app proactively sending data to it.
By convention, apps expose an internal /metrics endpoint on port 9091. So, let's set this up in express.
Adding our own metrics, exposed via Express.js
First, we'll install the express prometheus middleware. We'll also add the optional prometheus-gc-stats package, so we can also expose the node.js garbage collection metrics.
Note: prometheus-gc-stats is no longer required, but we cannot use the latest v14 prom-client yet. So, we'll use v13 for now.
npm i [email protected] [email protected]
npm i --save-dev @types/[email protected]
Next, we'll add the middleware to our express server.ts. An important thing to note here is that we don't want to expose /metrics on our public app!
To accomplish this, there are two parts:
- We include the middleware on our
appto monitor requests - But we create a
metricsAppserver on the9091port. This port will only be exposed to internal services.
import path from 'path';
import express from 'express';
import compression from 'compression';
import morgan from 'morgan';
import prometheusMiddleware from 'express-prometheus-middleware';
import { createRequestHandler } from '@remix-run/express';

const app = express();

if (process.env.ENABLE_METRICS) {
  const metricsApp = express();

  app.use(
    prometheusMiddleware({
      metricsPath: '/metrics',
      metricsApp: metricsApp,
      collectDefaultMetrics: true,
    })
  );

  const metricsPort = process.env.METRICS_PORT || 9091;

  metricsApp.listen(metricsPort, () => {
    console.log(`✅ metrics ready: http://localhost:${metricsPort}`);
  });
}
I like to conditionally set up metrics collection with the ENABLE_METRICS=true environment variable, so we can easily turn it on for local troubleshooting, but mostly it is only enabled in production.
This is enough to get some basic metrics exposed, but we can customize the metrics a bit more for our app.
We can configure requestDurationBuckets, requestLengthBuckets, and responseLengthBuckets with some reasonable defaults to create nice histograms.
Because we are running on Fly.io, we should also add some custom labels to distinguish metrics coming from different regions or apps (e.g. our staging app). These values are exposed via special environment variables.
app.use(
  prometheusMiddleware({
    metricsPath: '/metrics',
    metricsApp: metricsApp,
    collectDefaultMetrics: true,
    requestDurationBuckets: [0.1, 0.5, 1, 1.5],
    requestLengthBuckets: [512, 1024, 5120, 10240, 51200, 102400],
    responseLengthBuckets: [512, 1024, 5120, 10240, 51200, 102400],
    customLabels: ['region', 'app', 'instance'],
    transformLabels: labels => {
      // region: short 3 letter airport code for the region
      labels.region = process.env.FLY_REGION || 'unknown';

      // app: the app exposing these metrics
      labels.app = process.env.FLY_APP_NAME || 'unknown';

      // instance: your app instance ID
      labels.instance = process.env.FLY_ALLOC_ID || 'unknown';
    },
  })
);
You can test this locally, by running the following:
ENABLE_METRICS=true npm run dev
We can then request the metrics with a basic GET request, so we can see the metrics we've exposed.
curl http://localhost:9091/metrics
You should see something like this (plus a lot more):
# HELP nodejs_heap_space_size_available_bytes Process heap space size available from Node.js in bytes.
# TYPE nodejs_heap_space_size_available_bytes gauge
nodejs_heap_space_size_available_bytes{space="read_only"} 0
nodejs_heap_space_size_available_bytes{space="old"} 53632
nodejs_heap_space_size_available_bytes{space="code"} 296064
nodejs_heap_space_size_available_bytes{space="map"} 184040
nodejs_heap_space_size_available_bytes{space="large_object"} 0
nodejs_heap_space_size_available_bytes{space="code_large_object"} 0
nodejs_heap_space_size_available_bytes{space="new_large_object"} 1031072
nodejs_heap_space_size_available_bytes{space="new"} 939928

# HELP nodejs_version_info Node.js version info.
# TYPE nodejs_version_info gauge
nodejs_version_info{version="v16.14.1",major="16",minor="14",patch="1"} 1
Deploy the app, and these metrics should start being collected by Fly.io's promotheus instance. Let's set up Grafana so we can take a look at them.
Setting up Grafana
Grafana is an open-source metric visualization and dashboarding tool. We'll need to deploy a separate app on Fly.io to host Grafana, but with a pre-built docker image, this will be pretty straight-forward.
Let's put this under ops/grafana/fly.toml to keep it separate from our main app's fly.toml. You'll need to replace synth-template with your own base app name.
app = "synth-template-grafana"

[build]
image = "grafana/grafana-oss:8.4.5"

[mount]
source = "grafana_storage"
destination = "/var/lib/grafana"

[env]
GF_INSTALL_PLUGINS = "grafana-clock-panel"

[[services]]
internal_port = 3000
protocol = "tcp"

[services.concurrency]
hard_limit = 25
soft_limit = 20

[[services.ports]]
handlers = ["http"]
port = "80"

[[services.ports]]
handlers = ["tls", "http"]
port = "443"

[[services.tcp_checks]]
interval = 10000
timeout = 2000
You can deploy this from your app's root directory like this:
fly apps create synth-template-grafana
fly volumes create grafana_storage --region dfw --size 10 --config ./ops/grafana/fly.toml
fly deploy ./ops/grafana
Lastly, go to your Grafana dashboard https://your-app-grafana.fly.dev/ and log in with username admin and password admin (and then create your own secure password).
Now, we will create a data source in Grafana to connect to the Fly.io prometheus server. You can follow the instructions on Fly's docs.
Quick Note: The Grafana app you deploy will be able to view all of the apps within your Fly.io account. So, you only need one of these!
Importing Pre-built Dashboards
Grafana doesn't include any visualizations out of the box, but you can quickly import existing public dashboards, so you don't have to start from scratch.
First, set up the Fly.io's pre-built dashboard following the instructions here.
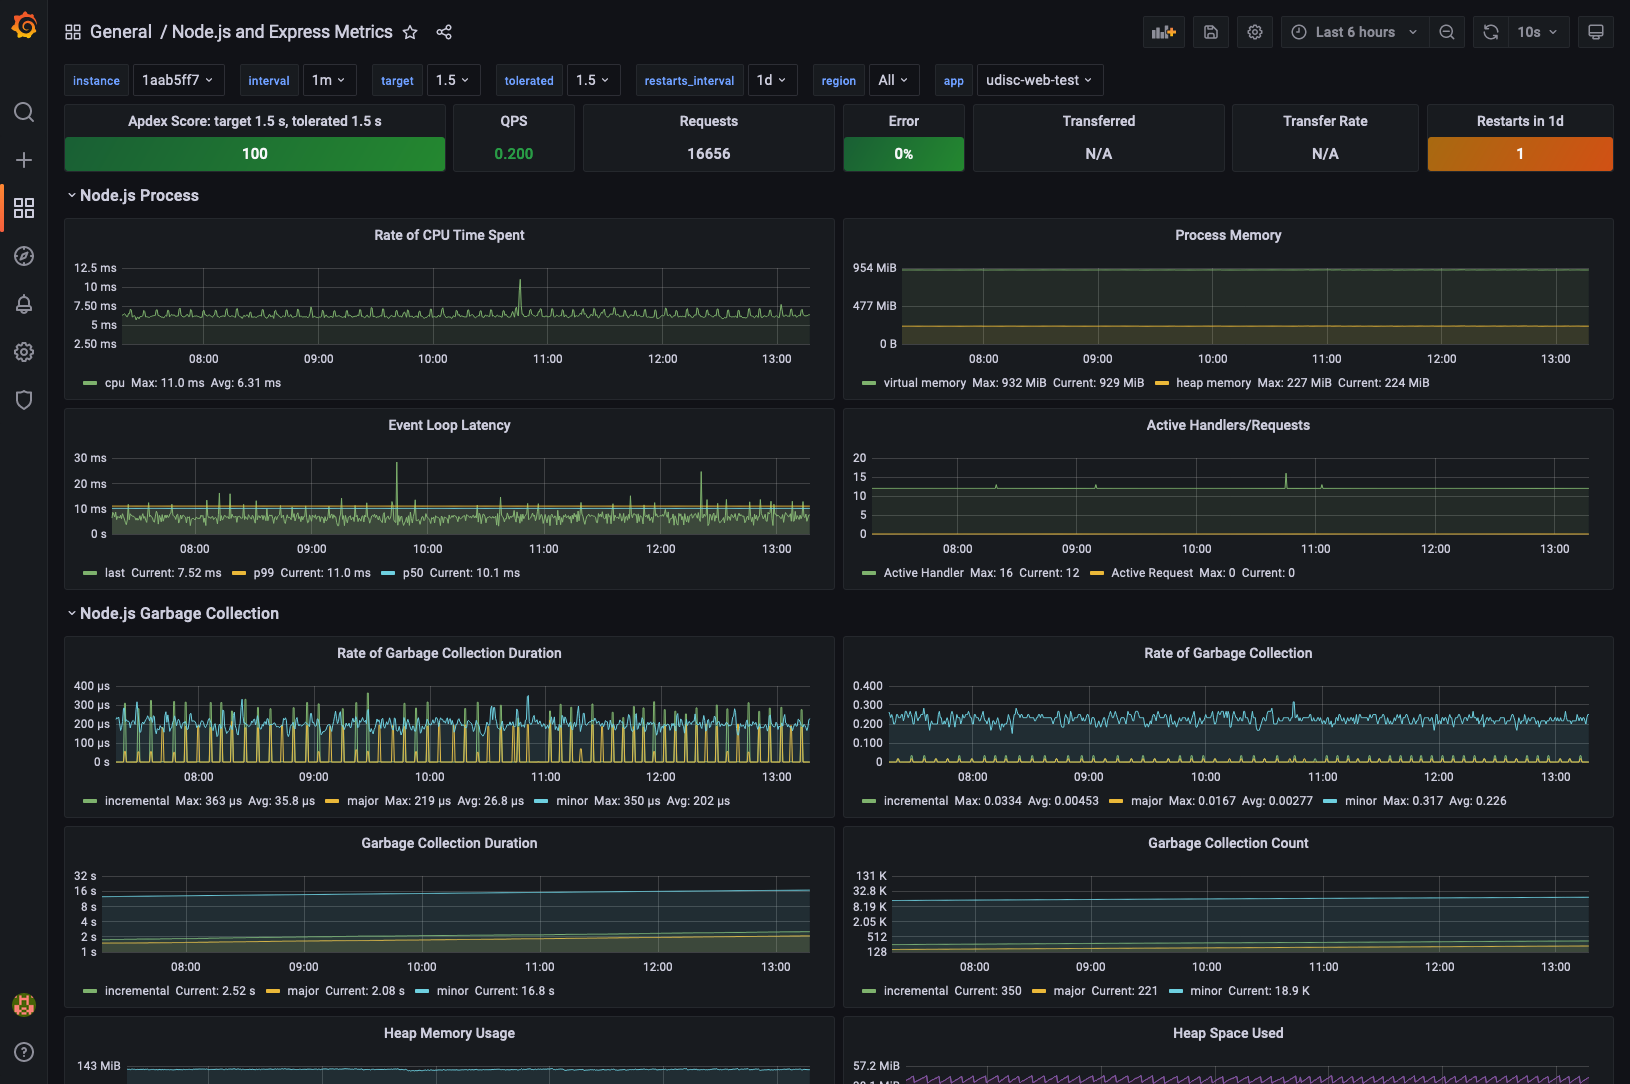
Then, following the same steps, you can import the Node.js and Express Metrics dashboard.
We can customize the Node.js dashboard to use the same app and region filters as the Fly.io dashboard. This is left as an exercise for the reader, for now.
You're All Set
You now have a basic set of metrics exposed for your app, and you can use them to monitor your app's performance or troubleshoot pesky issues in production. Let me know if you have any questions or if you have ideas on adding some Remix-specific metrics! You can find me on the Remix Discord or on Twitter.